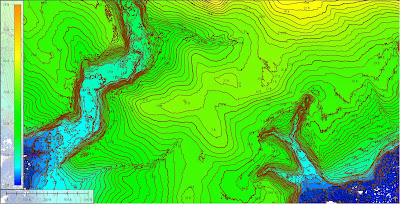
We get quite a few
questions about the contour lines produced as part of the dataset from our
HD-LiDAR process. They are typically described as “jagged” or having too many
bends. While most engineers and surveyors are familiar with the concept of what
contour lines represent, they are used to contour lines produced based on data
collected by a survey crew, which collect data along features and on approximate
grids for areas of constant grade. This grid is typically spaced at 50 foot
intervals for larger areas, but can vary in density based on field conditions,
budgetary constraints and the experience of the field crew. The wide grid
scheme, and use of smoothing or splining settings in the computer yield
contours which are pretty, but live up to their traditional definition of
showing approximate lines of equal elevation. LiDAR data collected at our
typical densities yields a grid with spacing of approximately 1 foot.
The increase in density of
measurements brings to the table an amazing amount of detail that no surveyor
would ever collect due to the time involved. LiDAR data shows small undulations
in terrain, particularly in flat areas like parking lots and fields. Another
area that shows increased detail is sand dunes, disturbed earth on construction
sites, quarries, landfills and stockpile yards. Airborne LiDAR strikes a very
efficient balance of covering large areas with a substantial amount of detail
without the burden of collecting hundreds or thousands of points per square
meter typically yielded by terrestrial scanning units. When the DTM is
produced, using breaklines that are all based on 3D points that in essence
identical to measurements produced by a survey field crew, the contours reveal
a much more accurate and precise representation of field conditions.
To view live HD-LIDAR datasets contact us today - viewable online or we can visit your office.

No comments:
Post a Comment